SMS logs
To view the SMS Logs screen, log in to the console and navigate to the Messaging > Logs page.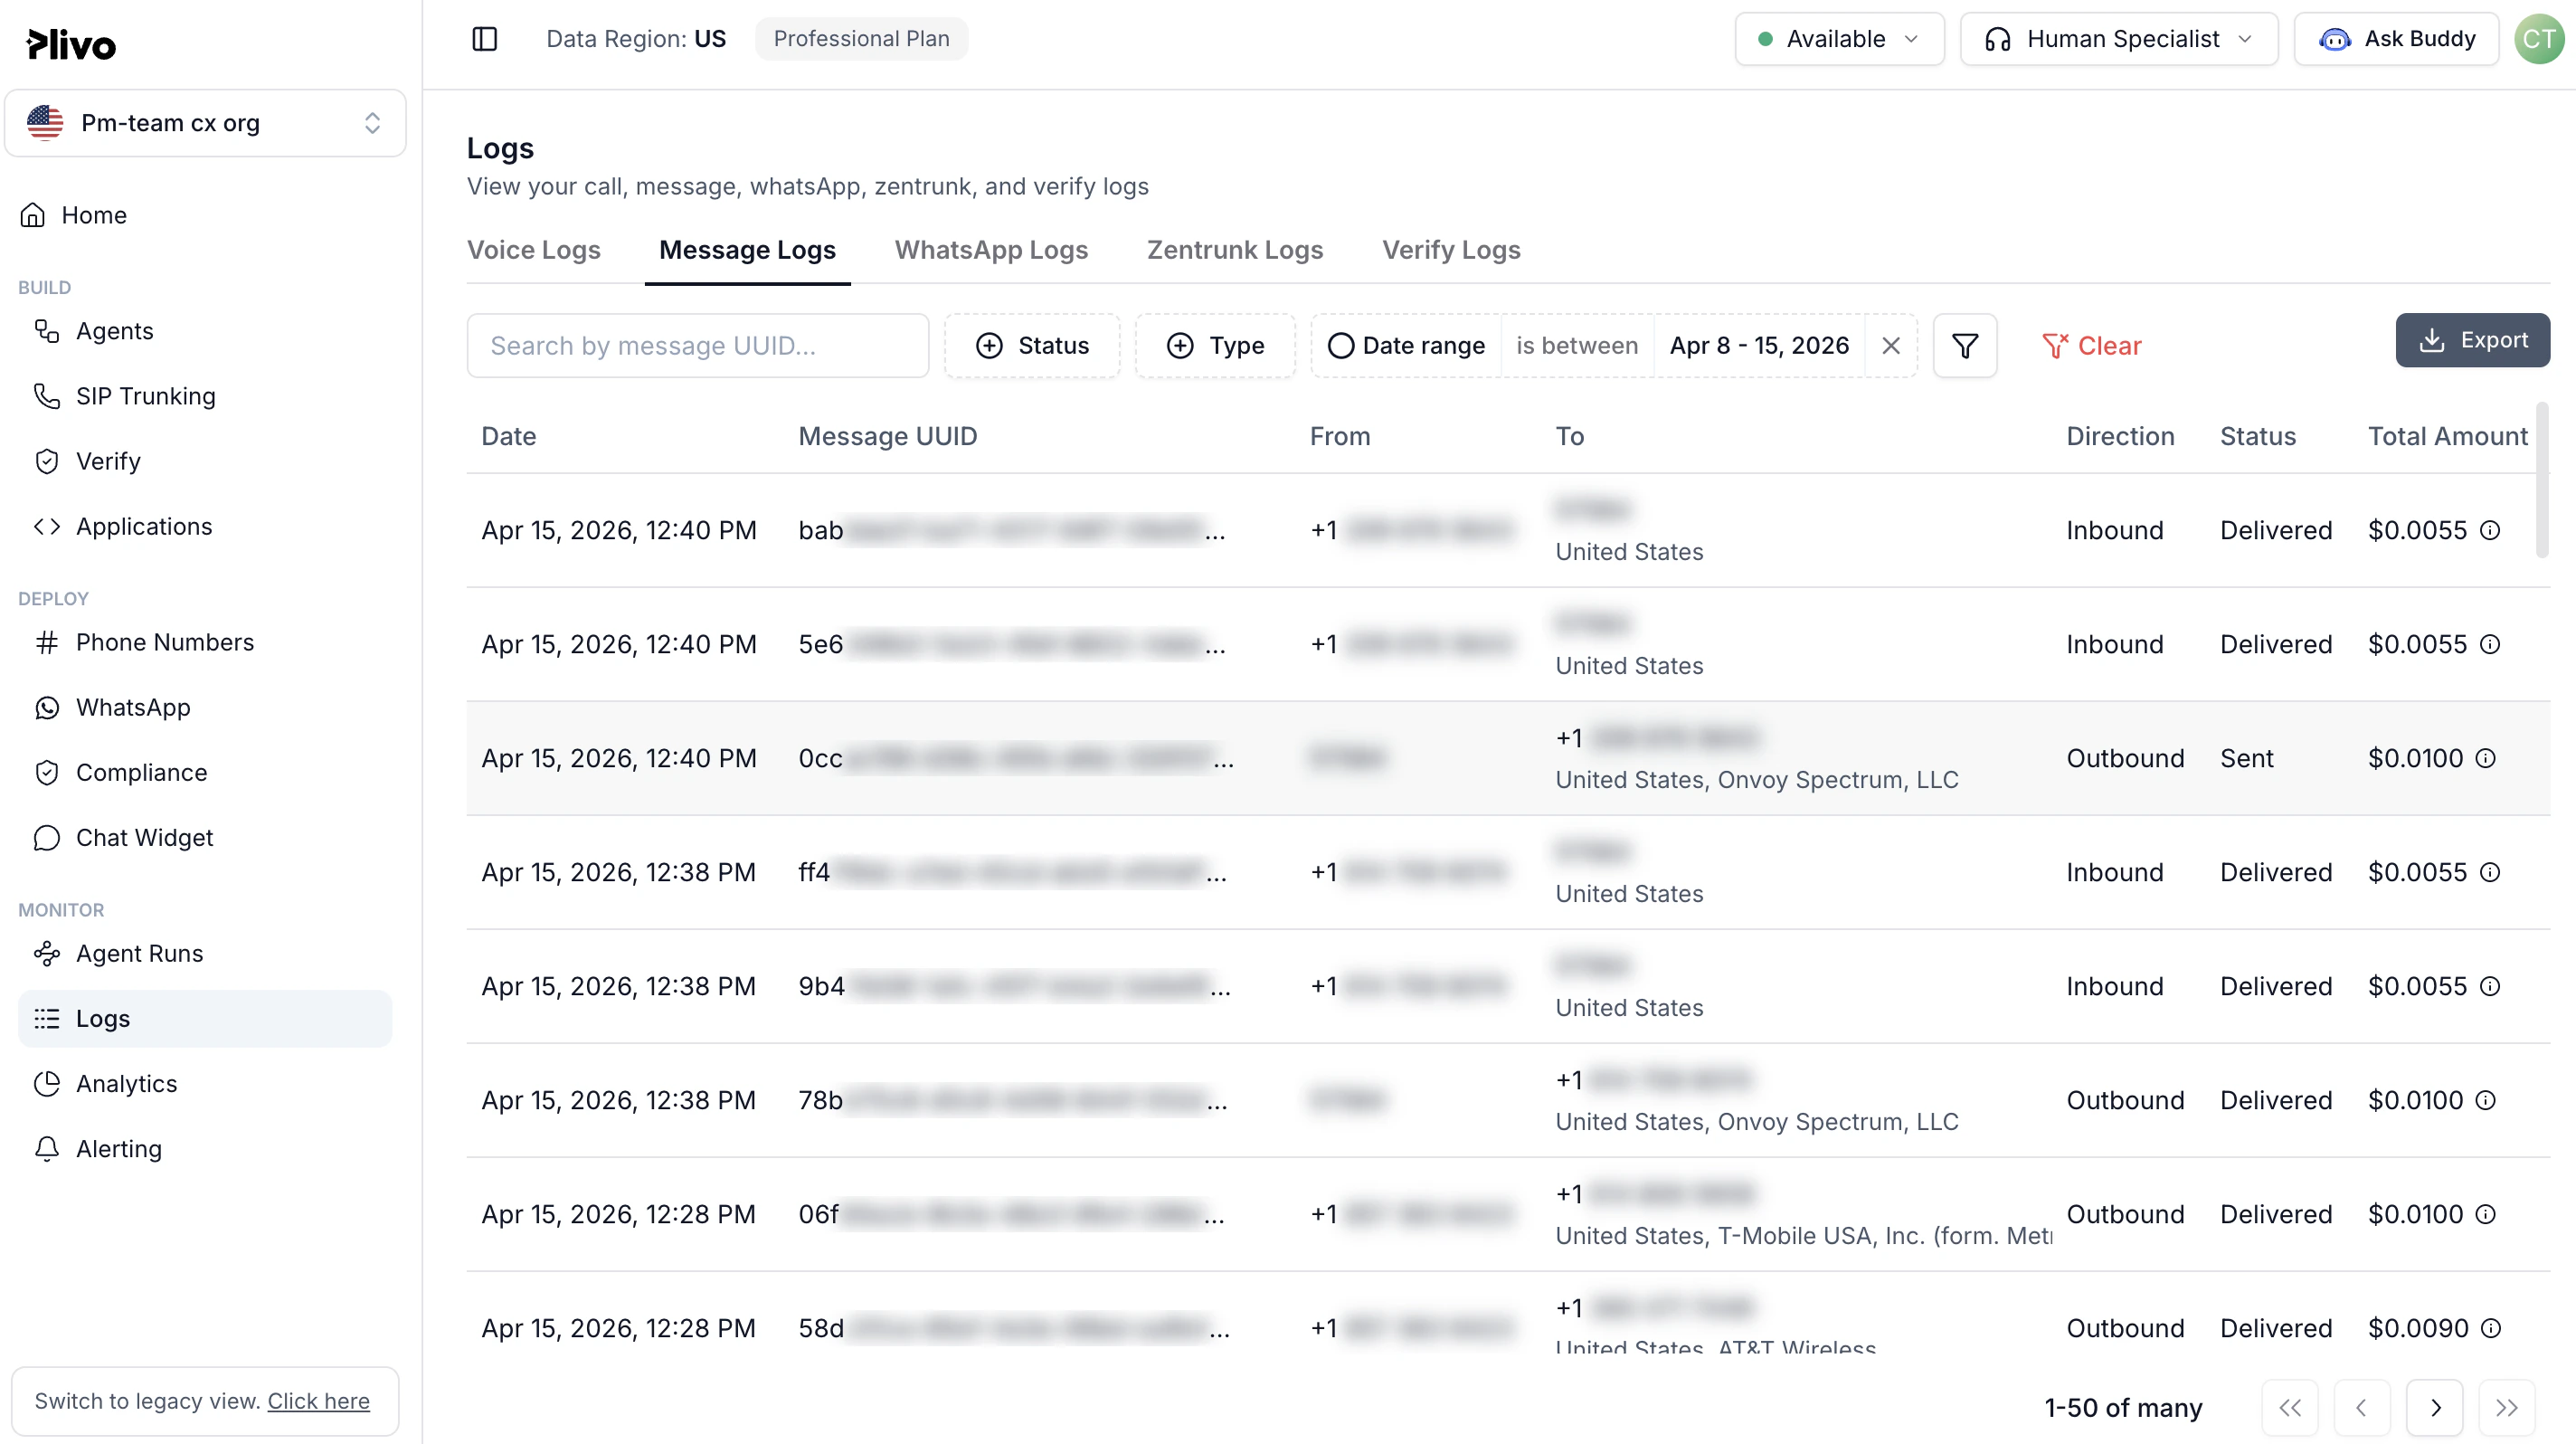
- Date: The time at which the message was queued in Plivo.
- From: The source number of the text message.
- To: The destination number of the text message.
- To country: Country ISO of the destination country.
- Direction: Message direction — Inbound or Outbound.
-
Status: The current status of the message.
Statuses for Outbound messages are
- Queued
- Failed
- Send
- Delivered
- Undelivered
- Received
- Delivered
- Undelivered
- Error reason: The reason for failure in cases where message status is Undelivered or Failed
- Total amount ($): Total amount charged for this message. This includes the carrier pass-through fees.
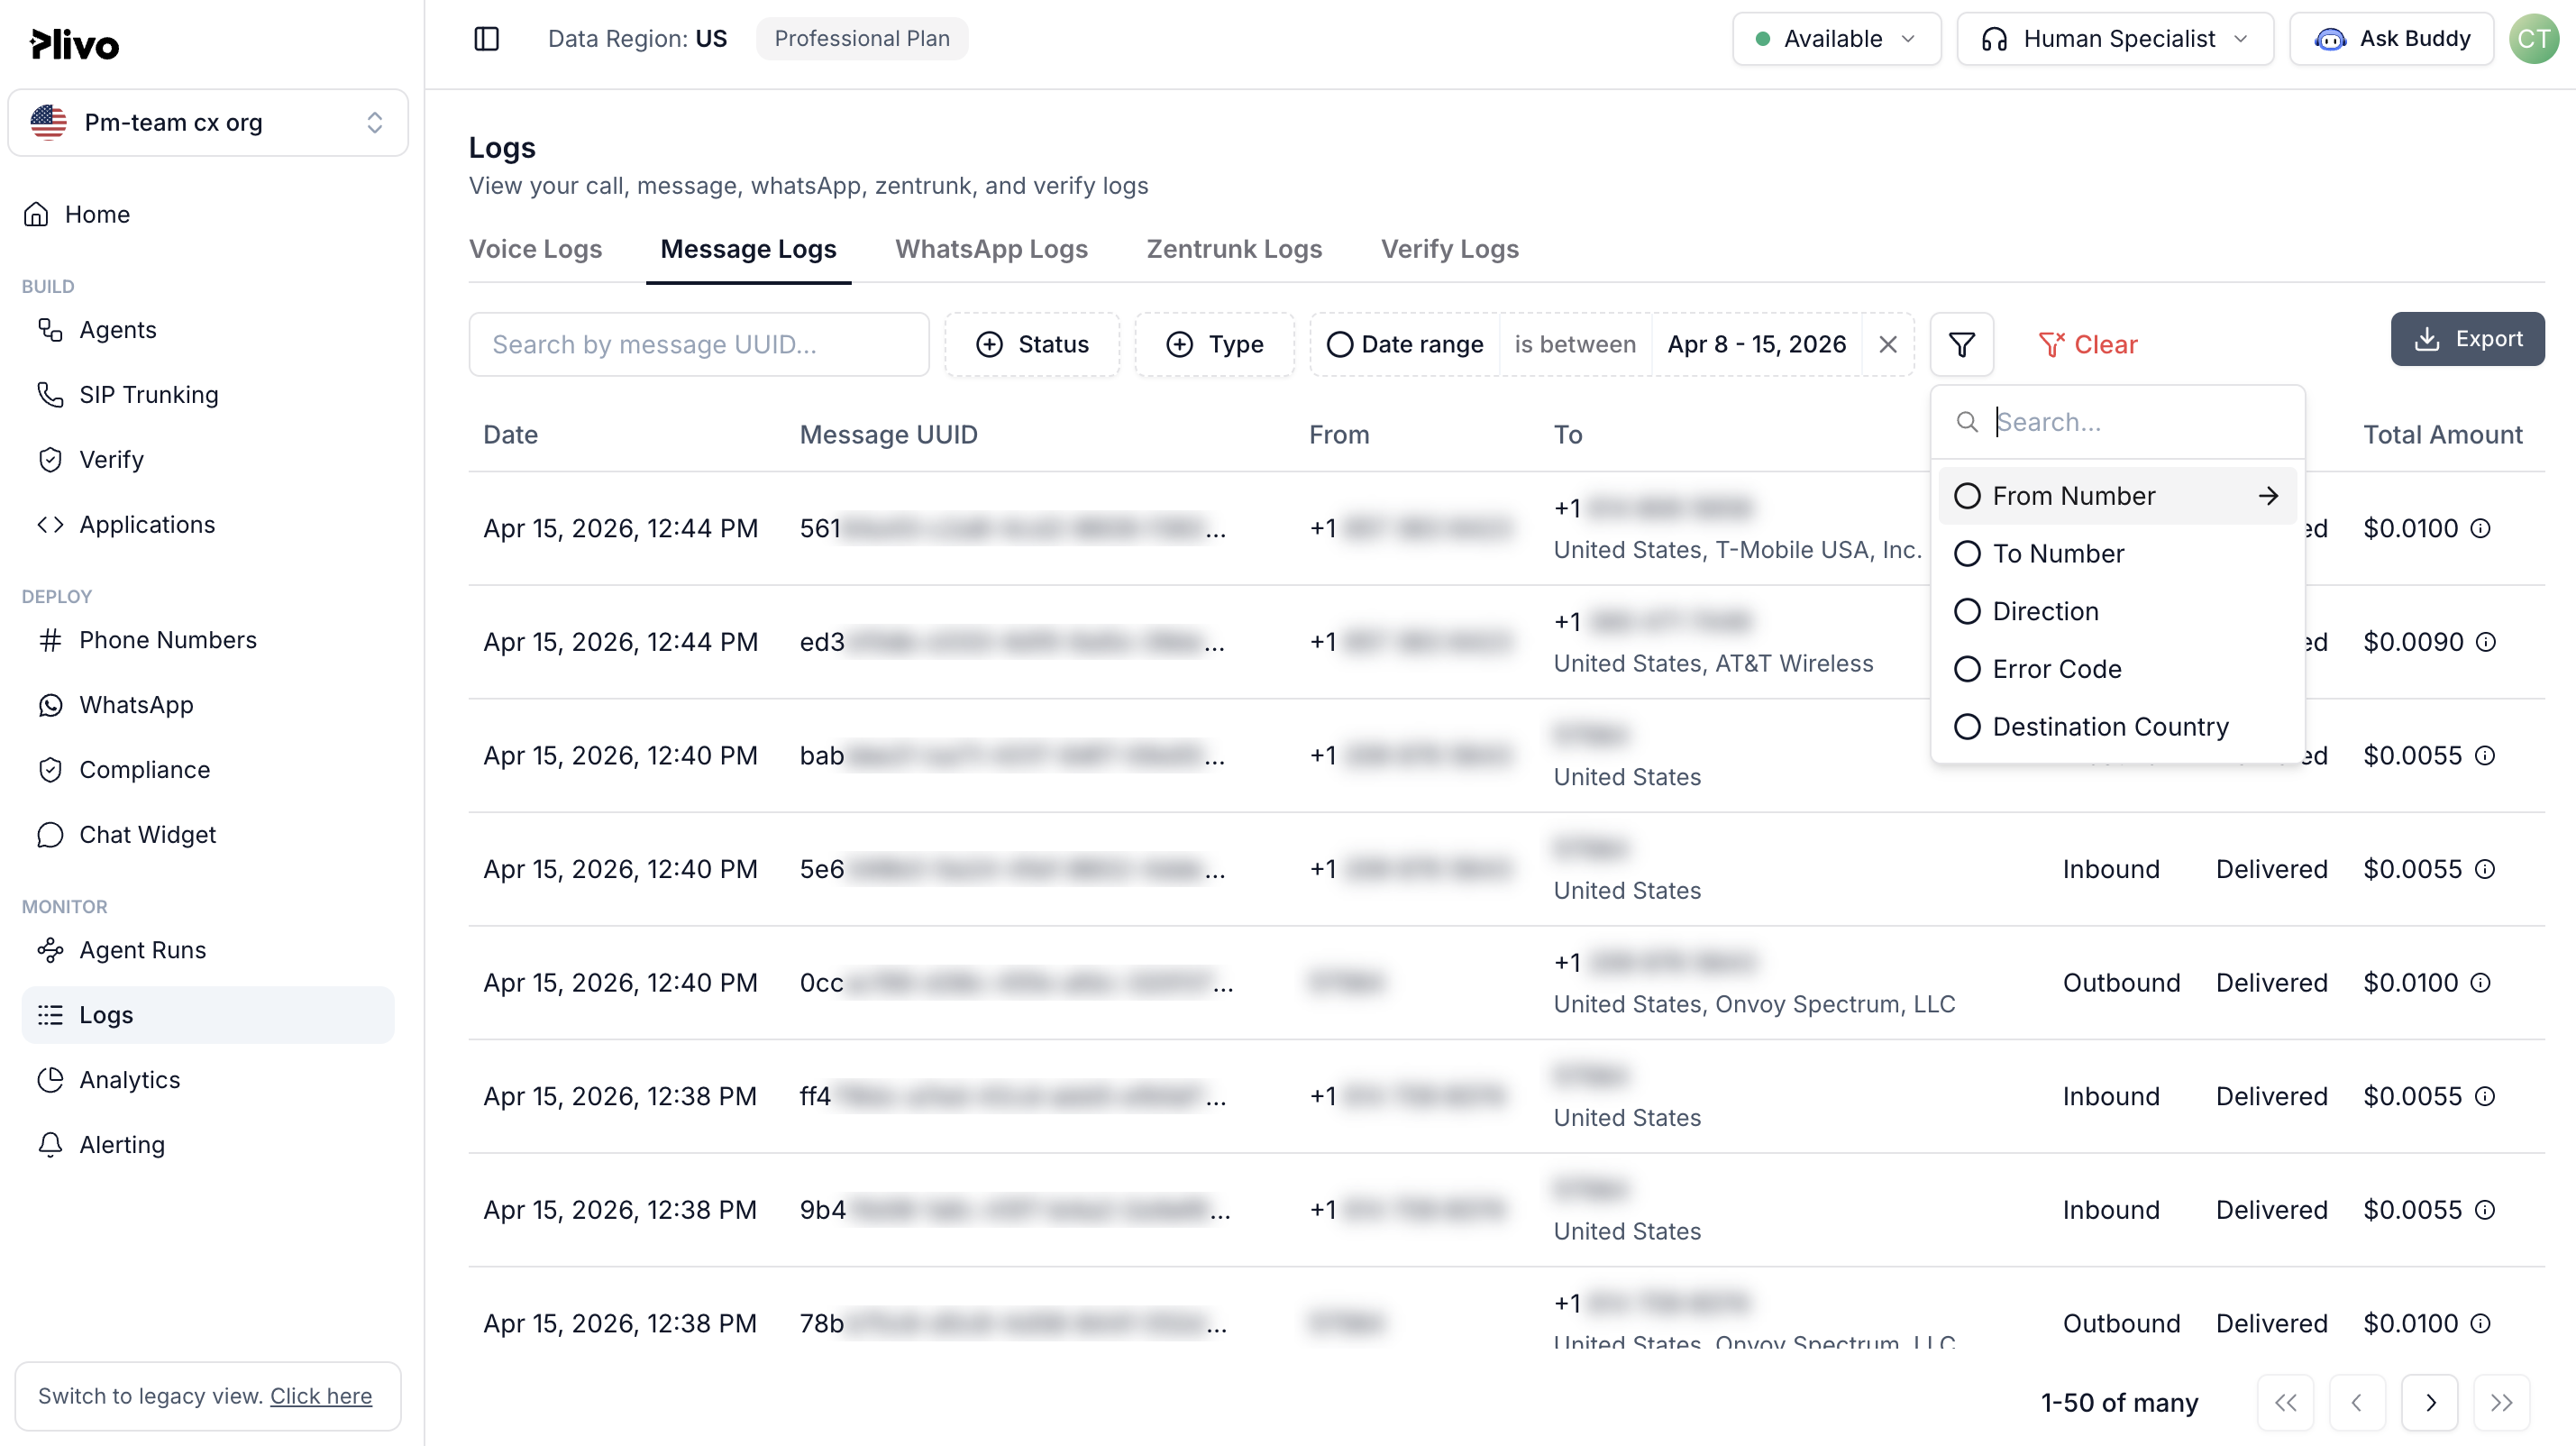
Filters
By default, all messages for your account are displayed on the Logs screen. Use filters to add context to the displayed results. You can filter your results based on:- From number
- To number
- Direction
- Status
- Error
- Time range
- Subaccount
Note: You can view data up to 90 days old on the Logs screen. Plivo doesn’t retain data for longer than 90 days.
Export
To analyze data, you can download the message details or the summary as a CSV file.Note: You can download CSV files with 10,000 or fewer records. Plivo will send you larger CSV files via email.
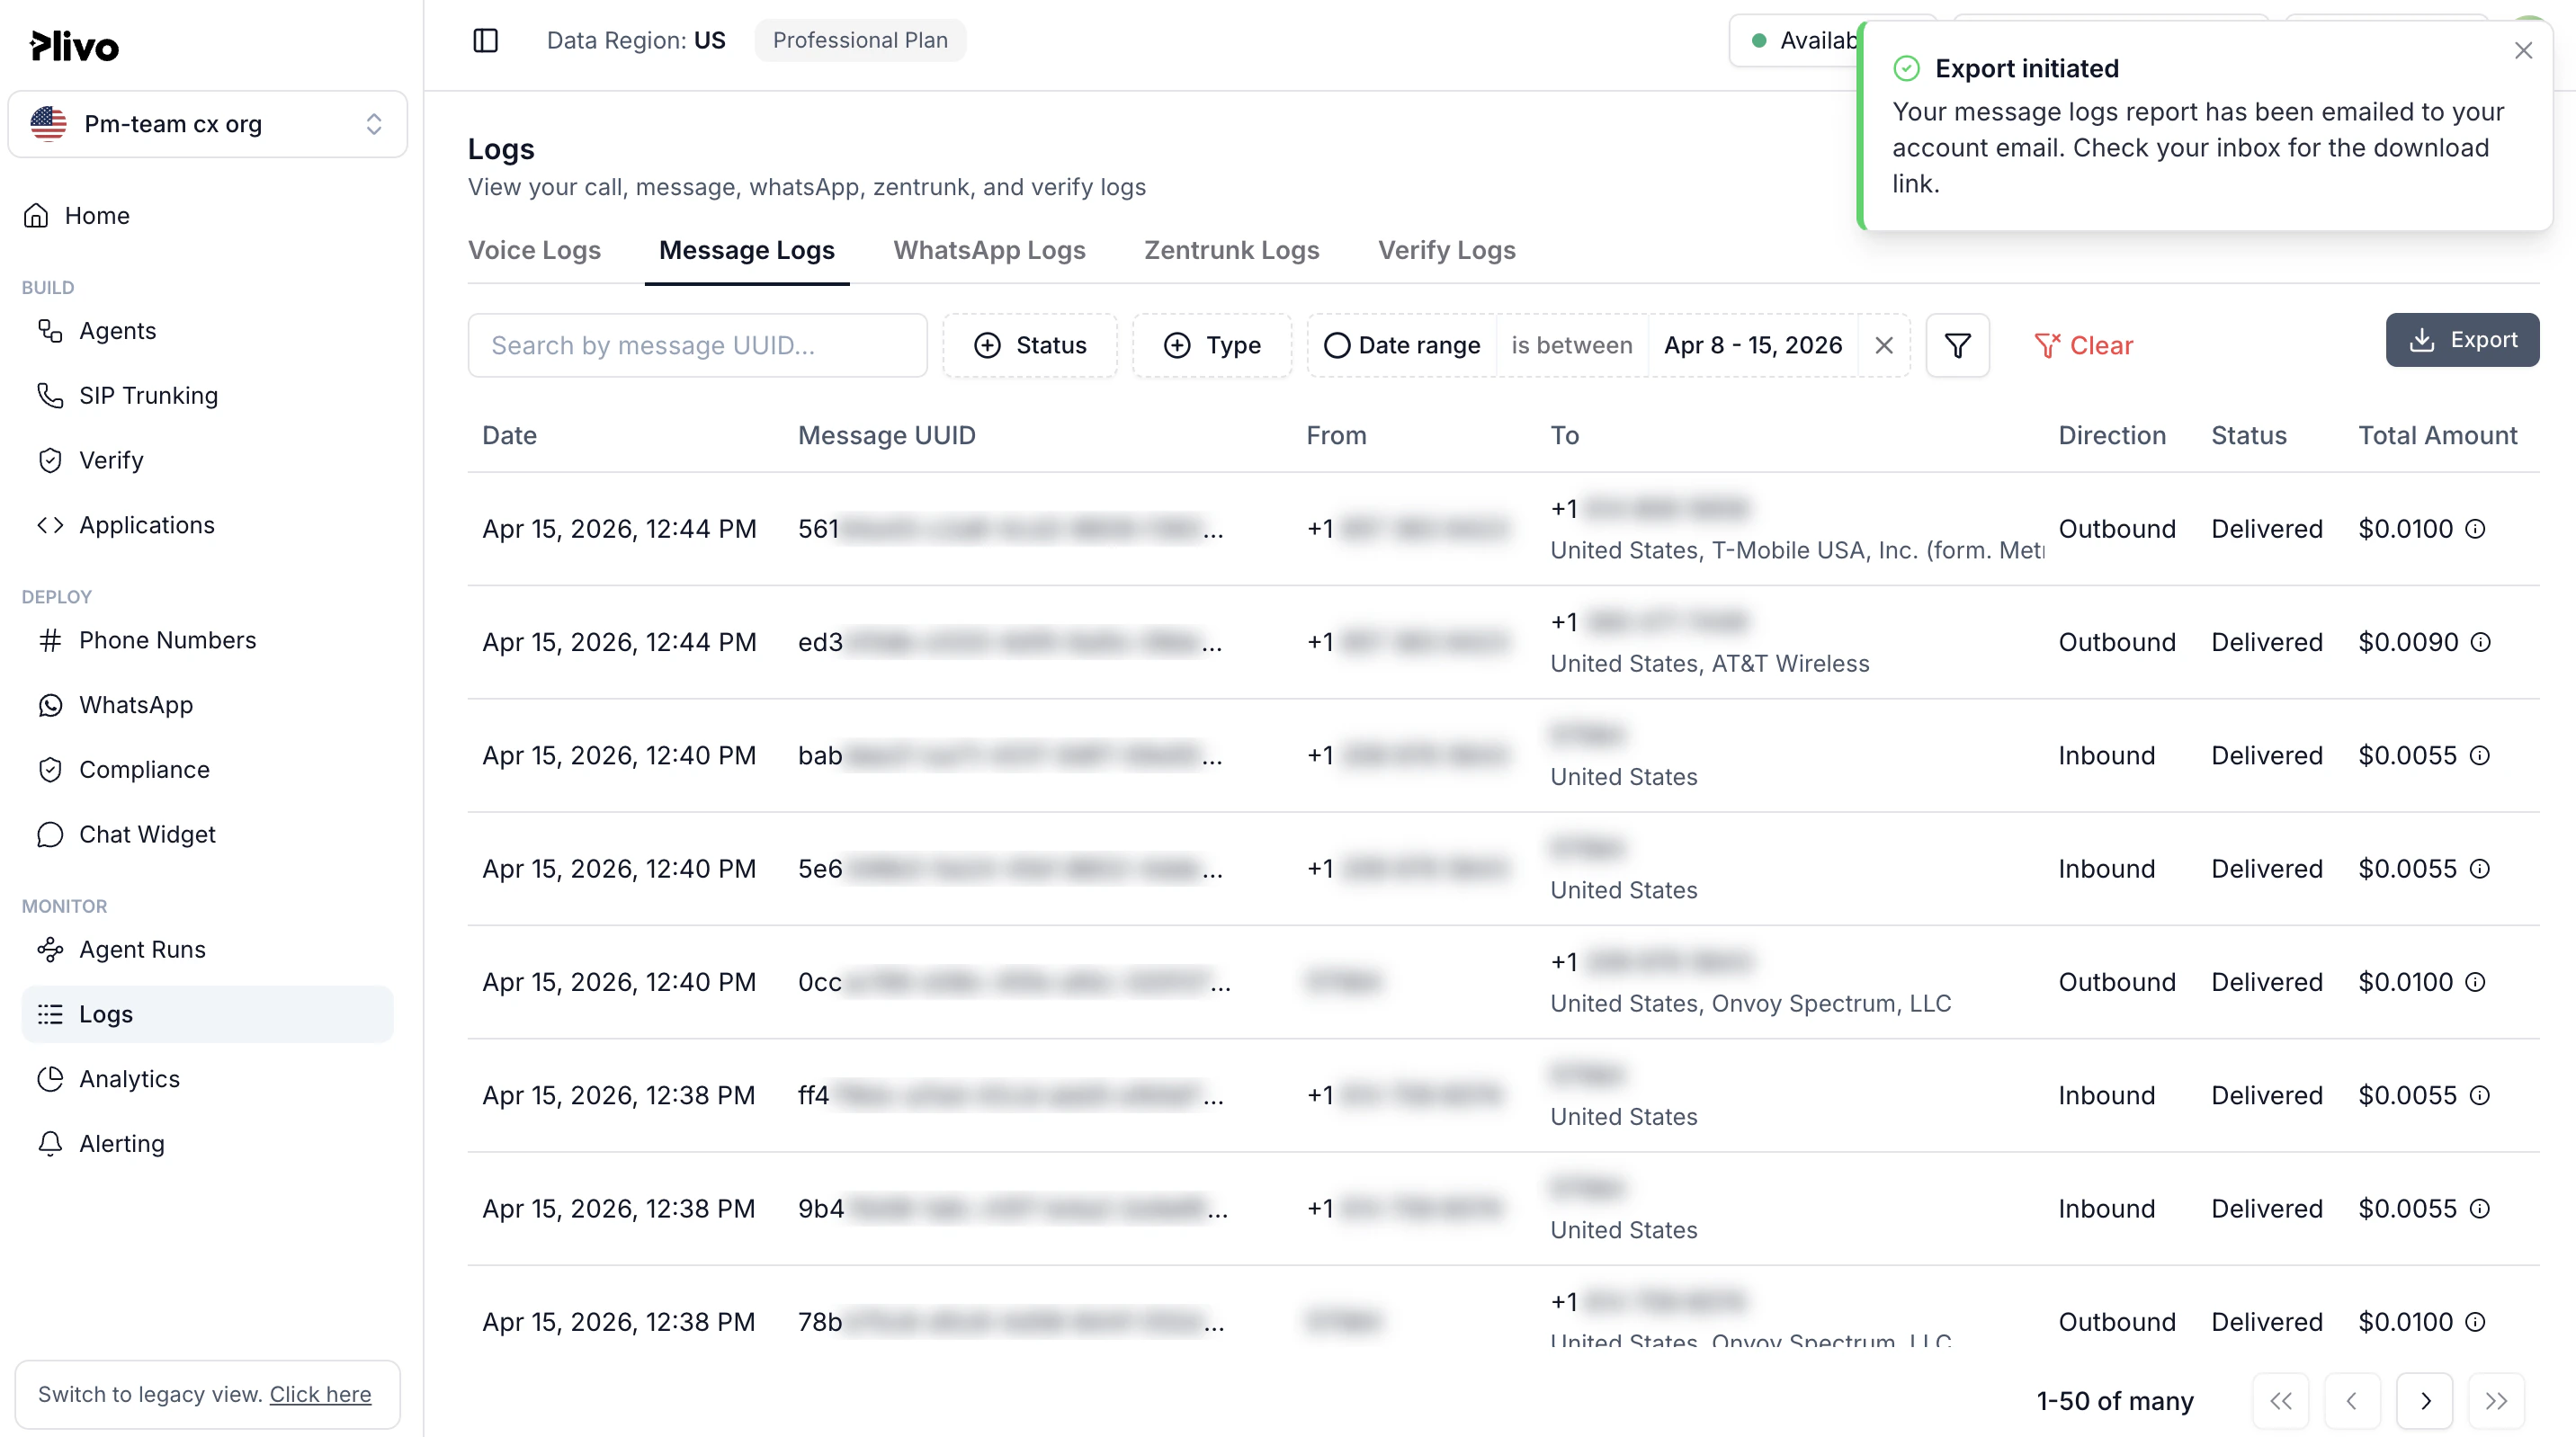
Export MDRs
To export all messages matching your filter criteria:- Enter the time range and your search keywords, if any, and then click Search.
- From the Export drop-down list, select All MDRs or Selected MDRs, then then click Export.
- Message UUID
- From
- To
- To Country ISO2
- Direction
- Message Time
- Status
- Error Code
- Error Reason
- Units
- Rate Per Unit (USD)
- Carrier Surcharge Per Unit (USD)
- Total Charge Per Unit (USD)
- Total Charge (USD)
Export Summary
To perform a high-level analysis of your SMS traffic, use the Usage Summary options from the Export drop-down list. You can view the usage summary by day, or by day and hour. MDR summary data includes:- Date
- Hour
- Subaccount ID
- Message Direction
- To Country
- Message State
- Mobile Country Code
- Mobile Network Code
- Error Code
- Error Reason
- Powerpack ID
- Application
- Message Intent
- Message Units
Note: For reference, download a file mapping Mobile Country Code (MCC) and Mobile Network Code (MNC) to network operators.
Examples
Here are some examples of how you can use the CSV data to gain insights:-
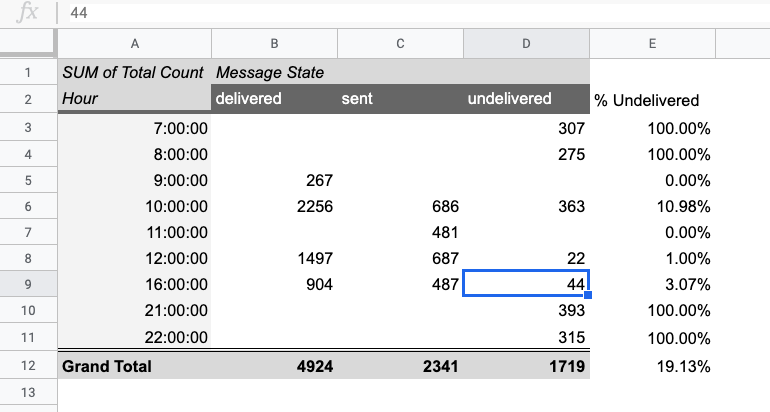
“During some hours of the day I see a dip in the message delivery of my outbound messages. What is the hour-wise distribution of outbound delivery rates for the last three days?”
- On the SMS Logs page, select the date range for the last three days.
- In the search field, tick Direction from the drop-down filter list and choose Outbound, then click Apply to display only the outbound messages.
- At the top of the rightmost column select logs on this page.
- To export the summary of the displayed data, select By Day & Hour from the Export drop-down list, then click Export.
- Select a folder to save the CSV file in, then click Save.
- You can use the downloaded CSV to surface the required data using Microsoft Excel or Google Sheets Data Pivots.
-
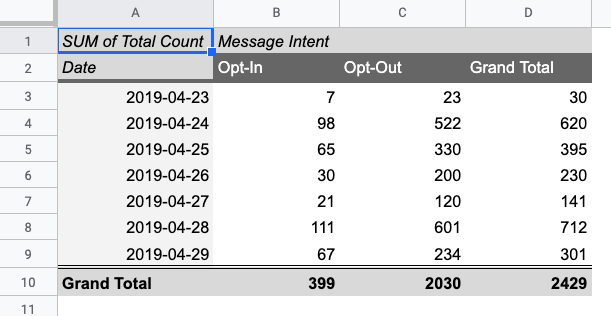
“I ran two SMS campaigns this week and want to monitor the daily DND opt-in and opt-out rates for that time period.”
- In the SMS Logs page, select the date range for the last week.
- In the search field, tick Direction from the drop-down filter list and choose Inbound, then click Apply to display only the inbound messages.
- At the top of the rightmost column select logs on this page.
- To export the summary of the displayed data, select By Day from the Export drop-down list, then click Export.
- Select a folder to save the CSV file in, then click Save.
- You can use the downloaded CSV to surface the required data using Microsoft Excel or Google Sheets Data Pivots.
-
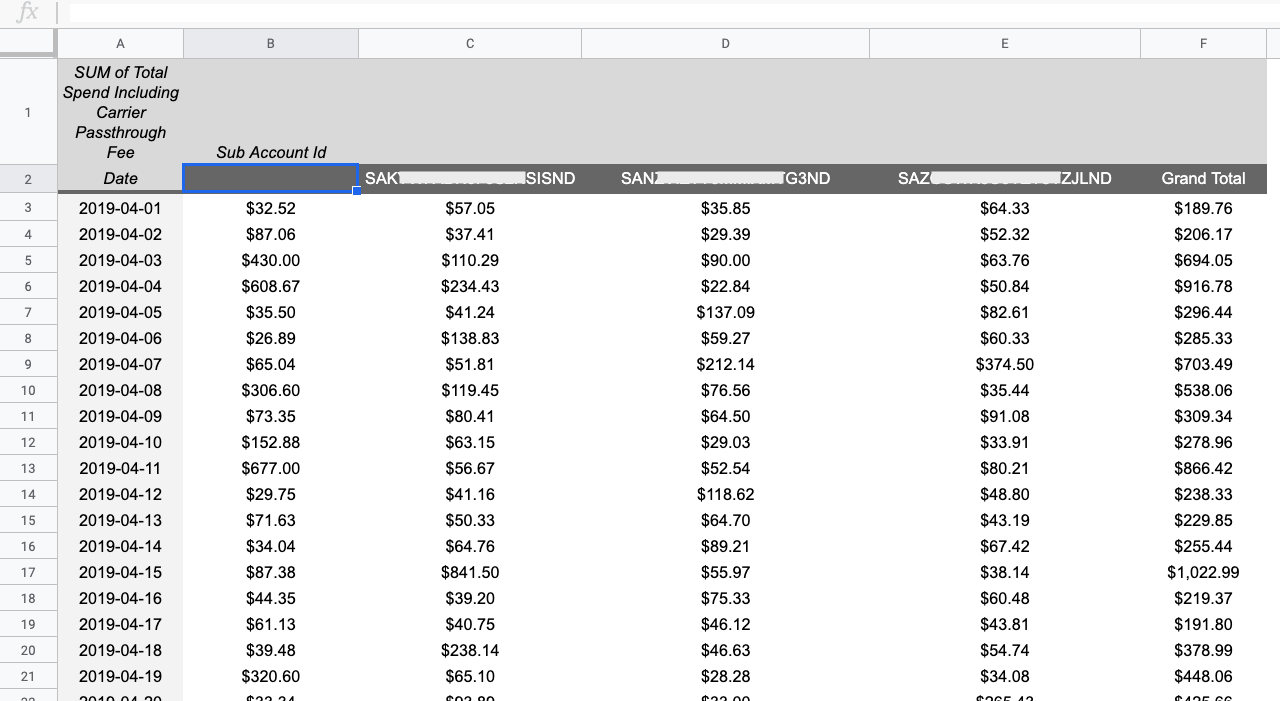
“I’m in the process of budgeting my SMS campaigns for the next quarter and I need to check my daily spends on SMS over the last month per subaccount.”
- On the SMS Logs page, use the Filter Logs drop-down, choose Date Range, select the start and end for the last month, then click Search.
- At the top of the rightmost column select logs on this page.
- To export the summary of the displayed data, select By Day from the Export drop-down list, and then click Export.
- Select a folder to save the CSV file in, then click Save.
- You can use the downloaded CSV to surface the required data using Microsoft Excel or Google Sheets Data Pivots.